


You can find blind spots in network monitoring by systematically checking which network segments, protocols, and devices fall outside the visibility of your monitoring tools. The most common gaps exist in physical layers, encrypted traffic, cloud environments, and devices that have never been actively configured for monitoring. This article answers the most frequently asked questions about detecting and addressing monitoring gaps in your network.
Where do blind spots in network monitoring most commonly occur?
Blind spots in network monitoring most commonly occur at the intersections of network segments, in encrypted traffic, and in environments that fall outside standard management tools. Think of IoT devices, OT networks, cloud connections, and physical infrastructure at OSI layers 1 and 2 that are rarely actively monitored. These are precisely where the greatest risks lie.
In practice, we see a number of recurring problem areas:
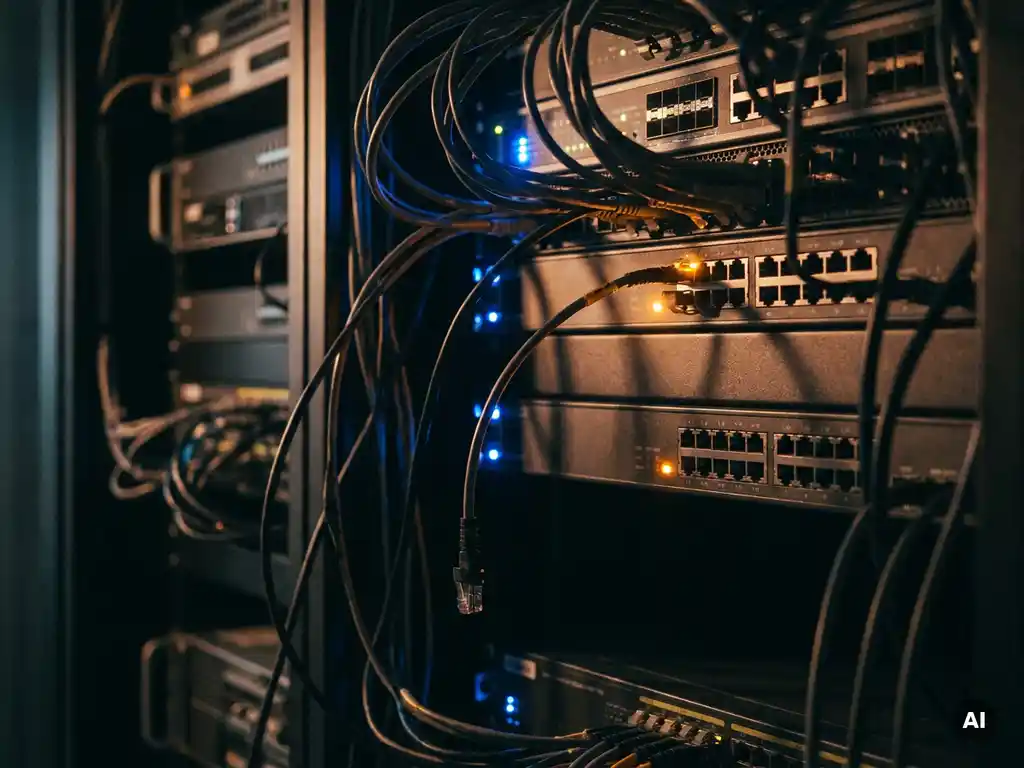
- Physical layer (layer 1): Fiber optic connections, patch panels, and passive components are often not actively monitored. A damaged fiber or signal loss then goes unnoticed until users report an outage.
- Encrypted traffic: TLS connections and end-to-end encrypted data traffic are invisible to many monitoring tools. Attackers know this and actively exploit it.
- Cloud and hybrid environments: Traffic that goes directly to cloud platforms often bypasses the traditional perimeter and therefore falls outside the visibility of on-premise tools.
- IoT and OT devices: Sensors, cameras, and industrial controllers communicate via protocols that standard monitoring tools do not always recognize.
- Shadow IT: Devices and applications that fall outside the official IT inventory are by definition invisible to your monitoring environment.
The danger of these blind spots is not only that you miss problems, but also that attackers specifically nest themselves in those unmonitored corners. Real-time monitoring of your fiber optic infrastructure is therefore not a luxury, but a necessary base layer for any serious monitoring strategy.
What is the difference between network monitoring and network observability?
Network monitoring measures predefined metrics such as bandwidth, latency, and availability. Network observability goes further: it combines metrics, logs, and trace data to also analyze unexpected and unknown problems. Monitoring tells you that something is wrong; observability helps you understand why.
The distinction is practically relevant. Traditional monitoring works well when you know what you want to measure. You set thresholds, receive alerts, and respond. But networks have become more complex. Microservices, distributed architectures, and hybrid cloud environments produce behavior that you cannot always predict in advance.
Observability fills that gap. By combining three data sources — metrics, logs, and traces — you can also identify unknown problems and determine their root cause. This is especially valuable for detecting monitoring gaps: if you only measure what you expect, you will never see what you do not expect.
For organizations working with business-critical networks, the move from pure monitoring to observability is a logical next step. It does require a broader data strategy and tools that can integrate multiple data sources.
How do you know if your monitoring tool has a blind spot?
Your monitoring tool likely has a blind spot if there are network segments, devices, or traffic flows that are not visible in your dashboards but are active in your infrastructure. Concrete signals include unexplained performance issues, incidents that are only discovered after users report them, or devices on your network that do not appear in your inventory.
A practical way to test this is to run a network discovery scan and compare the results with what your monitoring tool reports. Devices that are discovered but not monitored are direct blind spots. The same applies to traffic flows that are visible in firewall logs but not in your monitoring dashboard.
Other indicators to watch for:
- Users or application teams report problems that you do not see in your monitoring environment
- Your monitoring tool does not cover traffic at layer 1 or layer 2 of the OSI model
- Cloud connections and SaaS applications are not included in your monitoring strategy
- You have no visibility into out-of-band management traffic
- New devices are automatically added to the network without appearing in your monitoring tool
The absence of out-of-band management is a common mistake. If your primary network connection goes down, you also lose visibility into exactly what is going wrong — unless you have a separate management network in place.
Which tools help identify monitoring gaps?
Tools that actively explore network segments, analyze traffic, and detect anomalies across multiple layers simultaneously are helpful for identifying monitoring gaps in your network. Think of network discovery tools, flow analysis software, SIEM platforms, and specialized solutions for physical layer monitoring.
Network discovery and inventory
A good foundation starts with knowing what is in your network. Discovery tools actively scan your network segments and map all devices, including those you did not expect. By comparing the output with your CMDB or asset management system, you can immediately identify which devices fall outside your monitoring scope.
Flow analysis and traffic inspection
Flow data, such as NetFlow or sFlow, provides insight into which traffic flows are actually occurring in your network. Traffic flows that do not match your expected patterns may indicate unknown devices, unauthorized connections, or attackers moving laterally through your network. Combine this with specialized monitoring and network management solutions for a more complete picture.
Physical layer monitoring
Fiber optic infrastructure requires specific tools capable of detecting signal loss, reflections, and physical intrusions. This is a layer that many organizations completely skip in their monitoring strategy, yet it is precisely here that physical attacks and failures can go undetected.
How do you structurally address identified blind spots?
You structurally address identified blind spots in network monitoring by prioritizing them based on risk, adding the appropriate monitoring layers, and establishing a continuous process for validating your monitoring coverage. A one-time fix is not enough: networks change constantly, and with them the gaps that can emerge.
An effective approach follows a fixed sequence:
- Prioritize by risk: Not every monitoring gap is equally critical. Start with segments that contain business-critical systems or that are directly connected to external networks.
- Add missing monitoring layers: If you lack physical layer monitoring, add it. If cloud environments are not covered, integrate cloud-native monitoring services into your central dashboard.
- Standardize onboarding of new devices: Ensure that every new device added to the network is automatically included in your monitoring environment. This prevents new gaps from forming.
- Validate your coverage periodically: Schedule at least a quarterly review in which your monitoring coverage is compared against the current network inventory.
- Invest in observability alongside monitoring: Add log and trace analysis so you can also detect unexpected behavior, not just the metrics you already knew about.
For organizations working with critical infrastructure — such as healthcare, transport, or data centers — it is wise to also include the security of physical connections. Protecting sensitive data starts, after all, with complete visibility into where that data flows.
Want to know where the gaps are in your specific monitoring environment? Our engineers are happy to think along with you, from the physical fiber layer to your cloud environment. We will map out the complete security and monitoring strategy for you and help you strengthen it step by step.
Ready for the next step?
Explore our solutions or get in touch directly with one of our experts.